
80+ Latest Influencer Marketing Statistics For 2026
Is influencer marketing still effective? Find out as we explore the latest influencer marketing statistics.
In this post, I’ll be sharing dozens of interesting stats and facts that shed light on the current state of influencer marketing.
These eye-opening insights reveal how brands and consumers really feel about influencer marketing this year and highlight the platforms, technologies, strategies, and trends that are shaping the industry.
Top picks:
- 83% of brands say influencer marketing is still effective (Influencer Marketing Hub1)
- 82% of marketers think influencer marketing generates the best-quality leads (Influencer Marketing Hub1)
- The average brand spends a quarter of their total marketing budget on influencer marketing (Aspire)
- The average cost-per-collaboration is $257 (Collabstr)
- 77% of influencers are women (Collabstr)
- TikTok & Instagram are the most popular social media networks for influencer marketing (Collabstr & Aspire)
- Snapchat is the least popular social media network for influencer marketing (Aspire)
- 63% of surveyed influencer marketers plan to use AI this year (Influencer Marketing Hub1)
- Over 60% of brands have worked with virtual influencers (Influencer Marketing Hub1)
General influencer marketing statistics
First, let’s look at some general statistics that tell us more about influencer marketing usage, and the current size of the market
1. The influencer marketing market size is expected to reach over $22 billion this year
$22.2 billion, to be exact. That’s more than double the market size in 2020 which was estimated to be $9.7 billion.
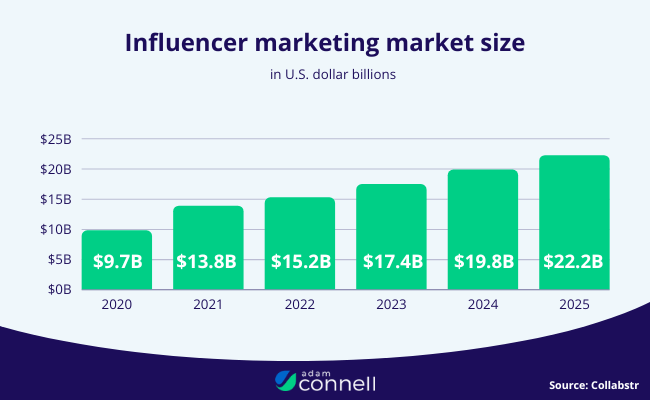
Source: Collabstr
2. The global influencer marketing platform market was expected to reach over 270 million USD this year
Influencers and advertisers aren’t the only people cashing in on the demand for influencer marketing. Software companies also stand to gain, with the market for influencer marketing apps/platforms expected to reach over $270 million in 2025.
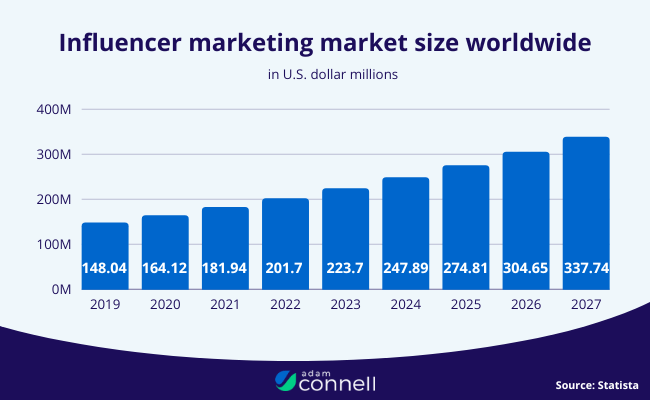
Source: Statista2
3. There were 18,900 companies offering influencer marketing services globally as of 2021
That’s up by a whopping 75% compared to 2019.
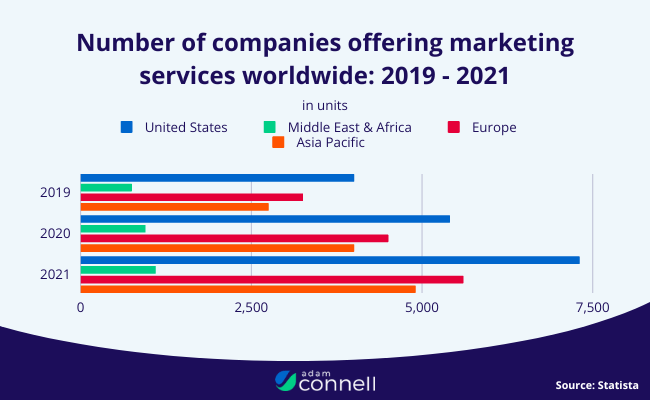
Source: Statista1
4. 83% of marketers and brands still think influencer marketing is effective
Influencer Marketing Hub surveyed thousands of professionals from brands, marketing agencies, and PR firms, and found that the vast majority still feel positive about influencer marketing.
However, that figure is down slightly compared to last year, when 90% said it was effective.
Source: Influencer Marketing Hub1
5. Around 61% of brands work with 10+ influencers
Only 39% of respondents in a recent survey said they work with less than 10 influencers. 21% said they work with 10-50, 16% said they work with 50-100, 11% said they work with 100-1000, and 12% said they work with over 1,000 influencers.
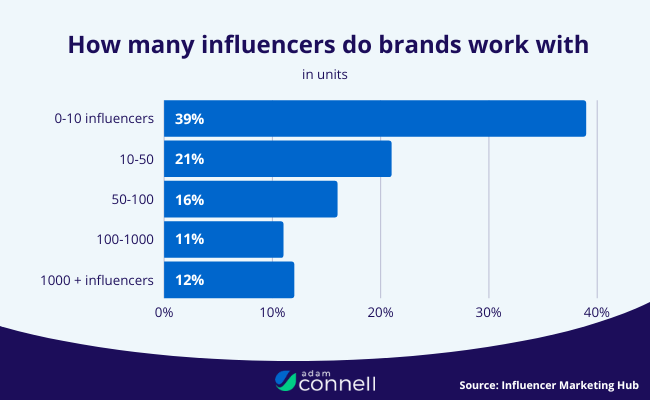
Source: Influencer Marketing Hub1
6. The top use case of influencer marketing is to generate UGC
This might be surprising to some, but according to a survey, 45% of brands run influencer campaigns for the primary purpose of generating UGC (user-generated content). This makes it the top objective this year.
Driving sales came in second place at 29%, and building awareness came third at 26%. This could have something to do with the rise of TikTok, which is all about UGC.
Source: Influencer Marketing Hub1
7. 48% of brands run influencer campaigns monthly
This is the most popular frequency for running influencer campaigns according to the survey. Only 18% of brands run campaigns quarterly, and just 15% do so annually
Source: Influencer Marketing Hub1
Influencer marketing benefits
Next, let’s look at some statistics that highlight the benefits of influencer marketing
8. 82% of brands think influencer marketing generates higher-quality customers than other types of marketing
Part of the reason influencer marketing is still relevant is that the leads it drives may be better than other marketing channels.
Source: Influencer Marketing Hub1
9. 61% of consumers trust recommendations from influencers as much as their friends and family
In comparison, only 38% trust recommendations from brands. This is why influencer partnerships can be so effective at driving sales.
Source: ProfitBlitz
10. 63% of brands repurpose influencer content on their branded social channels
Influencer marketing doesn’t just generate leads and sales, it also gives you access to valuable content that you can repurpose elsewhere.
63% of surveyed brands repurpose the content from their influencer collabs on their own socials. A further 56% repurpose it for paid ads, 50% for website/product pages, 43% for email campaigns, and 9% for use in out-of-home activations like billboards. Only 18% of surveyed brands said they don’t bother repurposing.
Source: Aspire
11. Healthcare brands stand to benefit the most from influencer marketing
According to Emplifi’s latest report, healthcare brands can increase audience reach by 18x and engagement by 4.9x compared to other brands in their industry.
These figures are more significant than in any other industry, which shows healthcare brands stand to benefit most from influencer marketing.
Accommodation brands were found to be the second best-placed industry to benefit from influencer marketing, with an average 18x increase in reach and a 4.2x increase in engagements from influencer collaborations.
Source: Emplifi
Influencer marketing costs
How much do brands spend on influencer marketing? Let’s find out.
12. Brands spend 25% of their marketing budget on influencer marketing, on average
According to data from Aspire, the average brand spends around a quarter of their total budget for marketing on influencer campaigns.
Source: Aspire
13. 23% of companies spend over 40% of their total marketing budget on influencer marketing
Influencer Marketing Hub also looked at how much companies spend on influencer campaigns, and they found substantial variation between companies.
This year, 23% of surveyed brands planned to allocate over 40% of their marketing budget on influencer campaigns. That’s up from 5% in 2022, 11% in 2021, and 9% in 2020.
A further 18% planned to allocate between 20 and 30% to influencer marketing (which is similar to Aspire’s figures), and 25% intended to allocate between 10 and 20%. The last 20% expected to spend less than 10%.
Source: Influencer Marketing Hub1
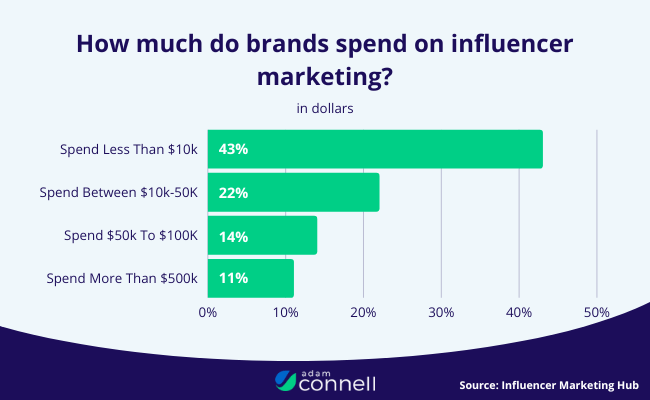
14. 43% of brands spend less than $10k on influencer marketing annually
A further 22% of brands spend between $10k and $50k on influencer marketing, 14% spend 50k to 100k, and 11% spend 500k+.
Source: Influencer Marketing Hub1
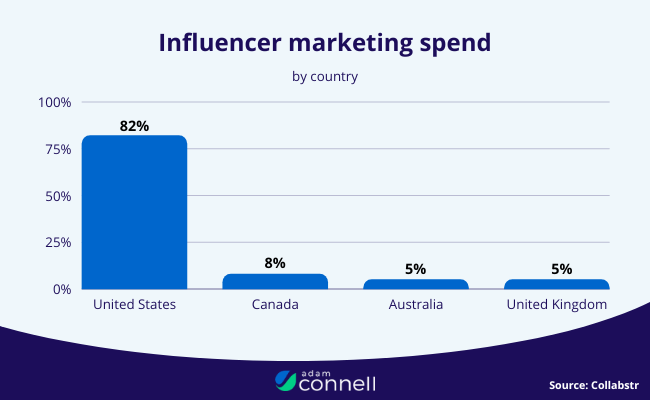
15. 82% of influencer marketing spend goes to influencers in the US
This makes the US the top country for influencer marketing spend by a large margin, per data from Collabstr. Canada ranks in a distant second place with 8% of total influencer marketing spend. And the UK and Australia come third with 5% each.
Source: Collabstr
16. The average brand spends $257 per collaboration
This seems to be the average price brands are willing to spend on a single influencer collab, per data from Collabstr.
Source: Collabstr
17. YouTube influencers ask for $791 per collab on average…
That’s more than influencers on any other platform and probably reflects the work that goes into making long-form videos. TikTok creators ask for the second highest amount per collaboration ($460 on average), while Instagram creators ask for just $363 per collaboration.
Source: Collabstr
18. …but brands only pay $418 for each YouTube collab, on average
Negotiations are a big part of influencer-brand collaborations, and brands typically end up paying about 50% of the asking price. On YouTube, they pay $418 on average. On TikTok, that drops to $203. And on Instagram, it drops to just $183.
Source: Collabstr
19. The average influencer marketing campaign costs $49,594
I know—that’s a lot.
But keep in mind that whole campaigns can sometimes run for months, or even years. If we break it down further, it looks like brands spend $2,075 per creator, per campaign.
Source: Aspire
20. The average cost per engagement for influencer marketing on TikTok is $0.21
That makes TikTok the second-best value for money if your goal is to generate engagements.
It loses out only to YouTube, which boasts an average cost per engagement of just $0.04. But keep in mind that’s largely because views count as engagements on YouTube as viewing a YouTube video is an explicit action taken by a user.
The average cost per engagement on Instagram is $0.57. On Facebook it’s $2.63, on Pinterest, it’s $5.51, and on Twitter, it’s an eye-watering $37.82.
Source: Aspire
21. 80% of companies plan to have a dedicated influencer marketing budget this year
That’s up by 3% from last year, and up double compared to 2017 when it was just 37%.
Source: Influencer Marketing Hub1
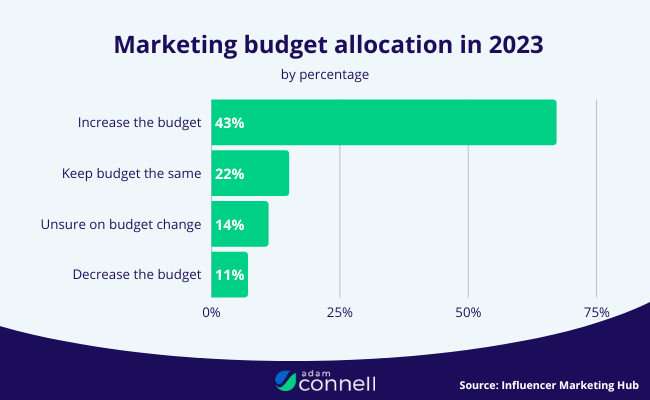
22. 67% plan to increase spending on influencer marketing this year
Of those that have a budget, over two-thirds plan to increase it in 2023. 15% plan to keep it the same as last year, and 11% aren’t sure how their budget will change, but only 7% plan on decreasing it.
Source: Influencer Marketing Hub1
23. 35% of brands employ 3-5 dedicated influencer marketers
Influencer partnerships aren’t the only cost involved in influencer marketing. Many brands also pay to employ dedicated influencer marketers. 35% employ between 3 and 5, 20% have 6+, and 45% have 0 to 2.
Source: Creator IQ & Tribe Dynamics
Influencer marketing engagement statistics
Next, we’ll look at some influencer marketing statistics that reveal more about the average engagement rates for influencer posts across platforms. Use them to benchmark your performance.
24. The average Instagram influencer post gets 852 engagements
That’s according to data from Aspire. Likes and comments were counted as engagements.
Source: Aspire
25. The average Facebook influencer post gets 68 engagements
Again, engagements were counted as total likes and comments. Interestingly, this is over 10x fewer than Instagram.
Source: Aspire
26. The average Pinterest influencer post gets 198 engagements
Post clicks, closeups, and favorites were all counted as engagements on Pinterest.
Source: Aspire
27. The average TikTok influencer post gets 6289 engagements
This is more than any other platform except YouTube. Likes, comments, and shares classed as TikTok engagements.
Source: Aspire
28. The average Twitter influencer post gets 245 engagements
Engagements on Twitter are classed as total likes and comments.
Source: Aspire
29. The average YouTube influencer video gets 78.5k engagements
That is significantly higher than any other platform, but part of the reason for this is that the study counted views as engagements on YouTube (alongside likes, comments, and shares). The reason for this is that users have to take a specific action to view videos on YouTube (as opposed to just scrolling through their feeds).
Source: Aspire
30. Nano influencers consistently get the best engagement rates
Nano influencers are classed as influencers with between 1k and 10k followers. These influencers generated more engagements than those with larger followings across platforms. The average nano influencer engagement rate is 67% on YouTube, 6% on Instagram, 2% on Facebook, and 59% on TikTok.
Source: Aspire
Influencer statistics
Next, we’ll look at some statistics that tell us more about the influencers/creators that brands work with.
31. 77% of influencers are female
The influencer landscape is largely dominated by women. Only 23% of influencers are male.
It’s worth noting that the gender gap varies by platform. It’s widest on Instagram, where 79% are female and just 21% are male.
Source: Collabstr
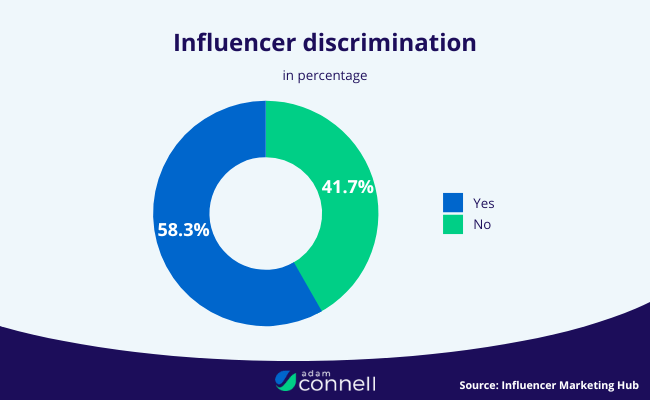
32. 58.3% of influencers feel they’ve experienced discrimination
If we split that up by social platform, 58.4% say they’ve received discrimination on TikTok, 13.6% on YouTube, 12.9% on Instagram, and 10% on Facebook.
Source: Influencer Marketing Hub1
33. 47.7% of influencers say they face discrimination based on gender
A further 21.75% said they’d experienced discrimination based on physical features, 13.3% said they’d experienced racial discrimination, 9% pointed to political discrimination, and 8% to sexual discrimination.
Source: Influencer Marketing Hub1
34. Lifestyle is the most popular influencer niche
According to data compiled by Collabstr, lifestyle was the most prevalent niche that influencers operated in. Other popular niches included fashion, beauty, travel, modeling, health and fitness, comedy and entertainment, food and drink, music and dance, and art and photography
Source: Collabstr
35. 81% of influencers work solo
A further 10% say they outsource some tasks, 7% say they work with a team of freelancers, and 2% say they work with a team of full-time employees.
Source: Creator IQ & Tribe Dynamics
36. 26% of influencers earn less than $500/month from content creation
Unfortunately, a quarter of influencers don’t seem to make a reasonable full-time income from content creation. However, 15% manage to earn over $5,000/month.
Source: Creator IQ & Tribe Dynamics
37. Only 8% of creators refer to themselves as ‘influencers’
Despite the prevalence of the term ‘influencer’, it seems like influencers themselves don’t prefer it. 47% prefer to use the term ‘creator’, and 45% like to use both terms interchangeably.
Source: Creator IQ & Tribe Dynamics
38. Around 7% of influencer content on Instagram is sponsored
This is down slightly year-over-year, which may be due to the economic downturn negatively impacting brand spending on marketing.
Source: Emplifi
39. Nano-influencers share 67% more sponsored posts than mega-influencers
Creators with less than 10k followers seem to be more prolific when it comes to brand collaborations than those with 100k+ followers. The reason for this is likely because nano-influencers tend to charge less, so brands can afford to work with them more frequently.
Source: Emplifi
40. Influencers with 100k+ followers share 27% more video content than those with less than 50k followers
The upshot: Sharing video content may be the secret to growing fast as an influencer.
Source: Emplifi
Influencer marketing campaigns & partnerships
Here are some influencer marketing statistics relating to brand-influencer partnerships and campaigns.
41. It takes 16 days to run an influencer collaboration from start to finish, on average
And the average influencer responds to a proposal from a brand in around 14 hours.
Source: Collabstr
42. The average influencer marketing campaign involves 188 posts
If the campaign runs for 3 months, that works out at around 2 posts per day. The average campaign also involves 46 creators.
Source: Aspire
43. The average influencer marketing campaign generates 233,783 engagements
If we divide that by the number of posts, it works out at around 1,243 engagements per post.
Source: Aspire
44. 70% of influencers say long-term campaigns are their favorite way to work with brands
Long-term campaigns involve individual influencers posting sponsored content multiple times over a long period. Only 23% of creators prefer one-off campaigns where they post just once.
Source: Aspire
45. 72% of brands run their influencer campaigns in-house
…which means only around a quarter outsource their influencer marketing campaigns to agencies.
Source: Influencer Marketing Hub1
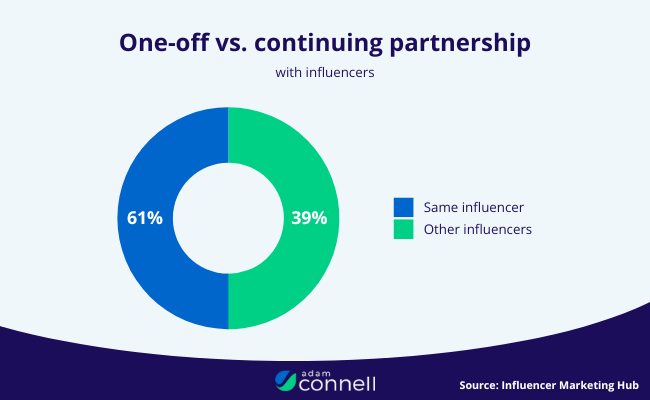
46. 61% of brands have used the same influencer more than once
Repetitive influencer partnerships are common, with most brands using the same influencers for different campaigns. The other 39% focus on one-off partnerships and use different influencers for different campaigns.
Source: Influencer Marketing Hub1
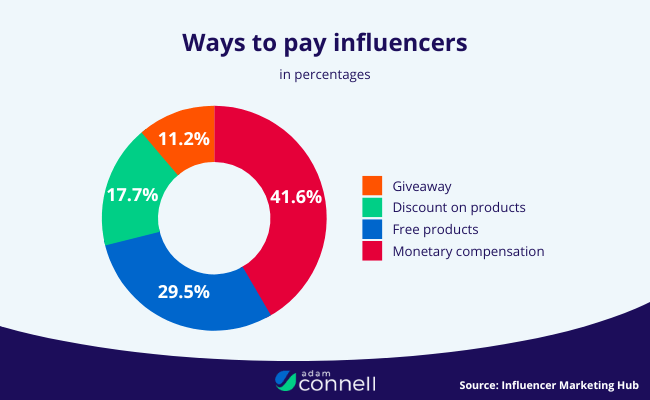
47. 41.6% of brands now pay influencers for partnerships, but…
Last year, the number of respondents in the survey who said they offered free products in exchange for promotion was roughly equal to those that offer monetary compensation, but the balance shifted significantly this year.
Now, 41.6% pay influencers through monetary compensation, while 29.5% pay with free products. A further 17.7% pay by offering discounts on their products, and 11.2% enter influencers in giveaways as payment.
Source: Influencer Marketing Hub1
48. …83% of influencers will work with brands for free products
But only if they like the brand or the product has a high value.
Source: Aspire
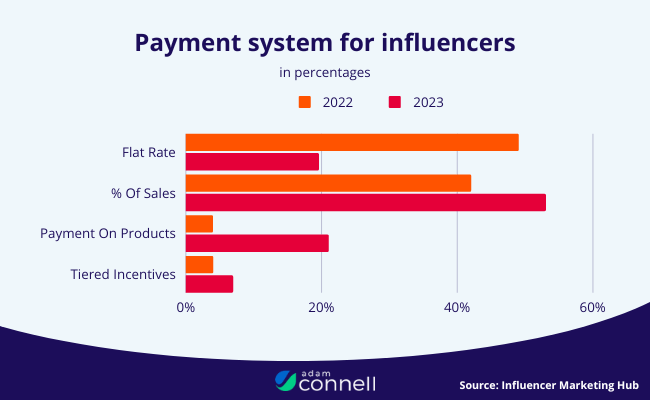
49. 53% of brands pay the influencers they partner with a percentage of sales
A further 21% pay based on product level, and 6.9% offer tiered incentives. Only 19.6% pay influencers a flat rate for their partnerships. This is significantly down from last year when 49% paid a flat rate.
Source: Influencer Marketing Hub1
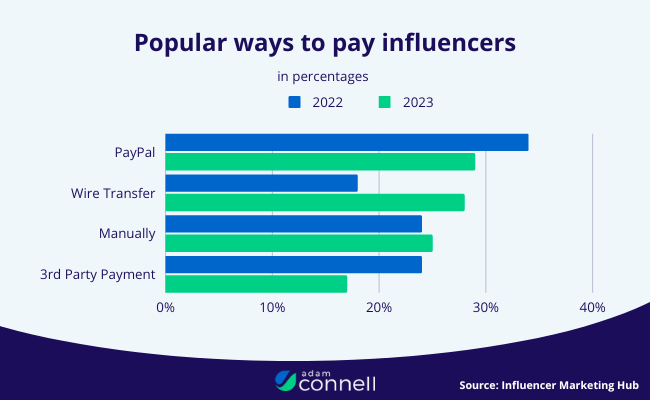
50. 29% of brands pay influencers via PayPal
This is the most common payment channel. Wire transfer came a close second at 28%, manual payments came third at 25%, and other third-party payment services came last at 17%.
Source: Influencer Marketing Hub1
51. 43% of influencers say product quality is the most important factor to consider in brand partnerships
Having quality products is a big deal to influencers. It’s more important even than compensation, which 24% said was the most important factor to consider. 20% said brand values are their biggest consideration.
Source: Creator IQ & Tribe Dynamics
52. 78% of creators say their top reason to stop working with brands is inadequate compensation
The upshot is clear: If you want long-term relationships, pay the influencers you work with fairly. Notably, 64% of surveyed creators also said poor products or services might lead them to stop working with brands.
Source: Creator IQ & Tribe Dynamics
53. 59% of marketers say influencers can become more valuable to brands by generating more interest & purchase intent
51% also say influencers can become more valuable by creating more suitable content.
Source: Blogging Wizard
Influencer marketing platforms
Which social media platforms are the most popular for influencer marketing? Let’s find out.
54. TikTok is the most popular platform for influencer marketing this year per Collabstr…
In 2020, TikTok was a mere blip on the radar. But just a few years later, it dominates the social landscape.
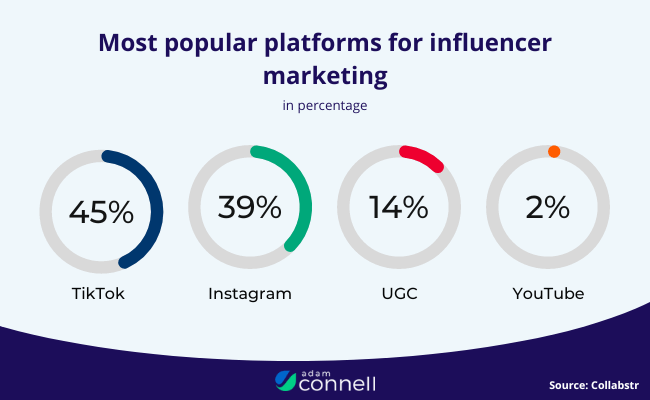
45% of paid collaborations now take place on TikTok, making it the most popular platform for influencer marketing.
Instagram came second, playing host to 39% of all paid influencer collaborations. In comparison, only 2% of influencer campaigns took place on YouTube.
Keep in mind that this stat is based on data extrapolated from 7,000 paid collaborations from the Collabstr marketplace, but it may not reflect the wider market.
Source: Collabstr
55. …But Instagram is the most popular platform for influencer marketing this year per Aspire
Aspire’s report has different results than Collabstr.
According to the Collabstr study, 87% of brands plan to utilize Instagram this year, putting it at the head of the charts and suggesting Instagram continues to be the most popular channel for influencer marketing.
The study also found that 68% plan to utilize TikTok (making it a close second), 45% plan to use YouTube, 41% Facebook, 28% Blogger, 22% Pinterest, 18% Twitter, and 4% Snapchat.
Source: Aspire
56. Snapchat is the least popular platform for influencer marketing
73% of brands plan to utilize Snapchat the least of any social media platform.
This makes it the least popular channel for influencer marketing by a relatively large margin.
Twitter also ranked highly, with 58% of marketers highlighting it as their least-used platform this year. Pinterest was the third least likely to be used with 43% of the results.
Source: Aspire
57. 42% of influencer marketers think TikTok delivers the best ROI for short-form video
Instagram Reels came a relatively close second at 34%. 19% said YouTube Shorts had the best ROI, and 6% said SnapChat Spotlights.
Source: Influencer Marketing Hub1
58. 90% of all influencers use Instagram
TikTok may be the most popular channel for brands to launch influencer campaigns on this year, but Instagram is still the creator’s favorite choice.
90% of influencers have an Instagram account, compared to 66% on Tiktok, 34% on Facebook, 4% on Twitter, and 4% on Pinterest
Source: Emplifi
Influencer marketing metrics & KPIs
The statistics below tell us more about the metrics and key performance influencers that brands like to track in order to measure the impact of their influencer campaigns.
59. 64% of brands said measuring and reporting on influencer marketing performance was their top priority
A further 37% said developing an effective influencer marketing strategy was their primary or secondary priority.
Source: Creator IQ & Tribe Dynamics
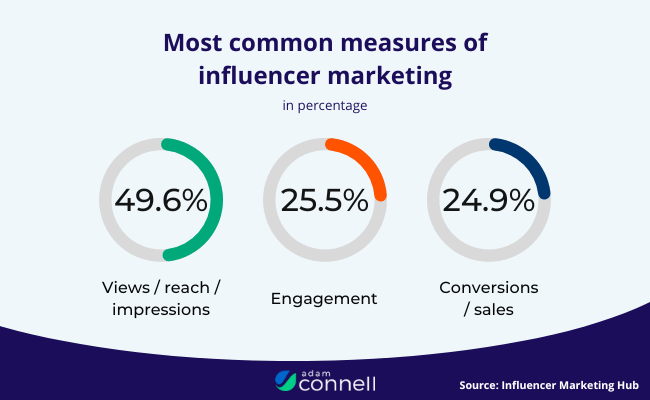
60. Almost 50% of brands look at views/reach/impressions to measure their influencer marketing success
Other popular KPIs include engagement/clicks (25.5%) and sales/conversions (24.9%).
Source: Influencer Marketing Hub1
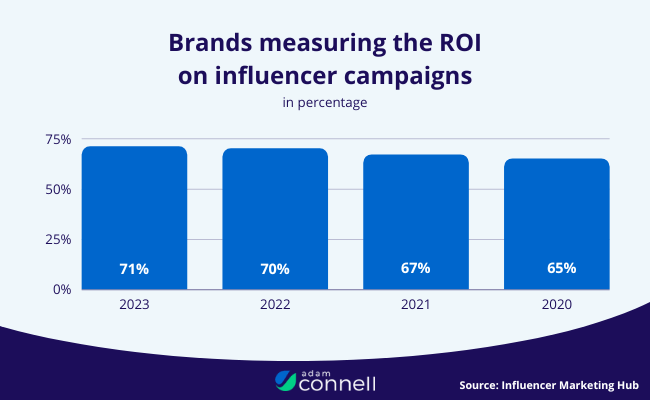
61. 71% of brands track ROI
Almost three-quarters of all brands that run influencer campaigns keep a close eye on the results to make sure they’re getting a positive return on investment.
Source: Influencer Marketing Hub1
62. 83% of brands think Earned Media Value is a good measure of influencer marketing ROI
Tracking return on investment (ROI) for influencer marketing used to be difficult, but it’s getting easier. Earned Media Value (EMV) is now the metric most brands look at to measure ROI.
Source: Influencer Marketing Hub1
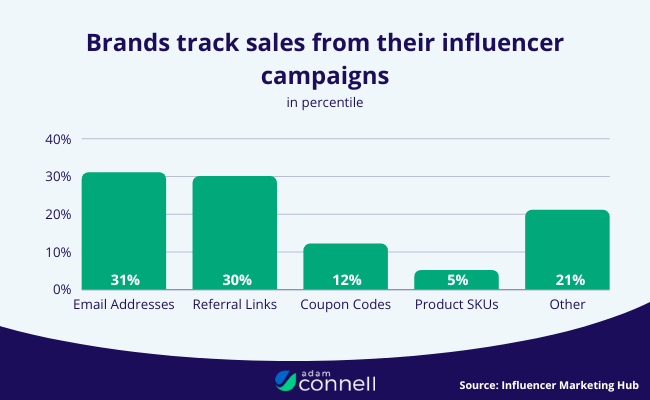
63. 74% of brands track sales from their influencer campaigns
The study also found that brands used different methods to track influencer-driven sales. 31% do so through email addresses, while 30% use referral links, 12% use coupon codes, 5% use product SKUs, and 21% use other methods.
Source: Influencer Marketing Hub1
AI in influencer marketing
Artificial intelligence is making waves across industries, and influencer marketing is no exception. Here are some statistics that tell us more about how AI is changing the influencer marketing industry.
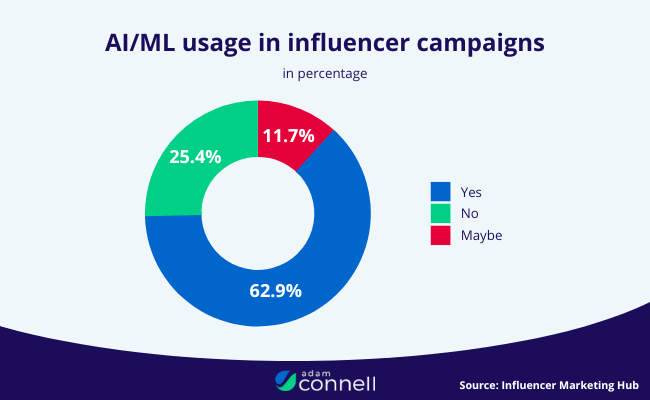
64. Around 63% of surveyed professionals plan to use AI or ML in their influencer campaigns
Artificial intelligence and machine learning are now used by the majority of influencer marketing professionals. In addition to the 62.9% that said they plan to use these technologies, a further 25.4% said they might, and only 11.7% said they had no plans to.
Source: Influencer Marketing Hub1
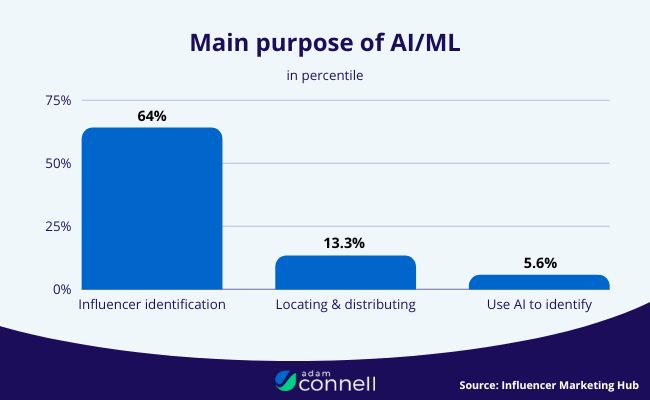
65. 64% plan on using AI/ML for influencer identification
This is the most common use case for AI/ML in influencer marketing. A further 13.3% said they’d use AI/ML to locate and distribute relevant content, and 5.6% said they’d use it to identify bogus influencers and engagements.
Source: Influencer Marketing Hub1
66. 40.9% of surveyed professionals think AI will revolutionize influencer marketing
And they’re probably right. AI (in particular, generative AI) is a highly disruptive technology that’s transforming many industries.
Source: Influencer Marketing Hub2
67. 50.4% of those that use AI technology for influencer marketing use Natural Language Processing
This makes it the most commonly used AI technology in influencer marketing. Machine learning was the second most commonly used form of AI at 28.7%, while deep fake technology came third at 24.3%, predictive analytics came fourth at 22.3%, and audience segmentation came fifth at 18.7%.
Source: Influencer Marketing Hub2
Influencer marketing software statistics
Here are some statistics that reveal more about the role software plays in influencer marketing.
68. 60% of brands use third-party software for influencer marketing
As we saw earlier, the influencer marketing software market is worth hundreds of millions of dollars. And that’s not all that surprising given that according to this stat, over half of all brands are using it.
Source: Influencer Marketing Hub1
69. 88% of brands use 1-3 influencer marketing software tools
Most brands seem to rely on just a few different tools in their influencer marketing stack.
Source: Creator IQ & Tribe Dynamics
70. 47% of brands increased spending on influencer marketing software this year
This reflects the wider increase in spending on influencer marketing in general.
Source: Creator IQ & Tribe Dynamics
71. 55% of companies use platforms for influencer discovery
This makes discovery the most popular use of influencer platforms.
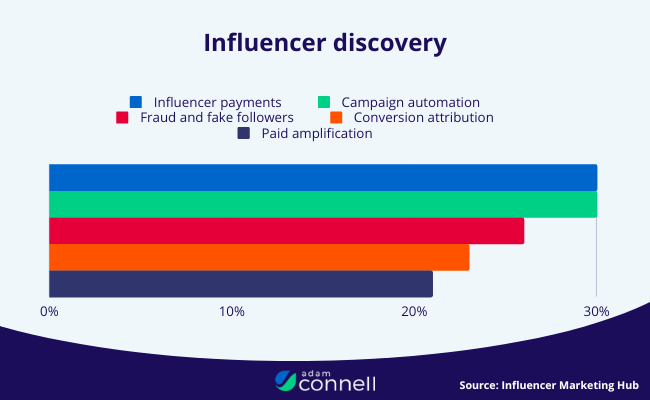
A further 30% said they use platforms for influencer payments, 30% said they use them for campaign automation and reporting, 26% for fraud and fake follower analysis, 23% for conversion attribution, and 21% for paid amplification.
Source: Influencer Marketing Hub1
72. 64% of influencers use marketplaces to connect with brands
There are lots of marketplaces out there that connect influencers with brands for paid collaborations, and as this stat shows, they’re very popular. A further 15% of influencers say they work with agencies to discover brand partnership opportunities.
Source: Creator IQ & Tribe Dynamics
73. 77% of brands think automation is vital in influencer marketing
That’s up from 56% last year. This stat highlights that automation software is another important part of the average influencer marketing technology stack.
Source: Influencer Marketing Hub1
Virtual influencer statistics
Virtual influencers are fictional, computer-generated influencers. The statistics below reveal more about how the rise of virtual influencers is changing influencer marketing.
74. Over 60% of brands have used virtual influencers in their campaigns
As this stat shows, the use of virtual influencers is a clear emerging trend in influencer marketing. Over half of all brands have now partnered with a virtual influencer.
Source: Influencer Marketing Hub1
75. 58% of US consumers follow at least one virtual influencer
The reason so many brands partner with virtual influencers is that they’re very popular. Over half of all consumers in the US follow one, according to data from Emplifi.
Source: Emplifi
76. CMOs are expected to spend 30% of their influencer budgets on virtual influencers by 2026
Virtual influencers offer a lot of benefits to brands over regular, human influencers. And as a result, CMOs are beginning to allocate more of their budgets to these computer-generated characters.
Source: Emplifi
77. The top virtual influencer on Instagram has over 2.8 million followers
The most popular virtual influencer in the world right now is @lilmiquela, with over 2.87m followers. Other popular virtual influencers include @thalasya_ (466.9k followers), @imma.gram (401k), @leyalovenature (352k), and @bermudaisbae (252k).
Source: Emplifi
78. 31.7% of brands think the main advantage of AI influencers is ‘more control over messaging’
A further 29.1% said 24/7 availability was the biggest advantage AI influencers offered over human influencers.
Source: Influencer Marketing Hub2
79. 43.8% of marketing professionals are concerned about the ethical considerations of AI influencers
AI influencers are a relatively new phenomenon, and the ethical implications of working with them are still murky, making many brands and marketers nervous.
Source: Influencer Marketing Hub2
Influencer marketing challenges
Finally, let’s look at some statistics that highlight the biggest challenges facing influencer marketers.
80. 64% of companies are worried about influencer fraud
Despite new tools to help detect fraudulent followers, this is still a major concern for many.
Source: Influencer Marketing Hub1
81. 22% of brands said scaling was the hardest challenge of influencer marketing
A further 16% said retaining partnerships with creators was their biggest challenge
Source: Creator IQ & Tribe Dynamics
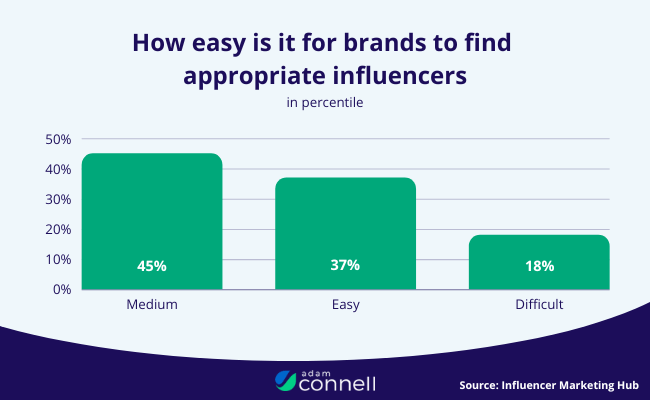
82. 18% of brands find it difficult to find influencers to work with
However, they’re in the majority. 37% of brands find it easy to discover influencers, and 45% rate the difficulty as ‘medium’.
Source: Influencer Marketing Hub1
Influencer marketing statistics sources
- Aspire
- Blogging Wizard
- Collabstr
- Creator IQ & Tribe Dynamics
- Emplifi
- Influencer Marketing Hub1
- Influencer Marketing Hub2
- ProfitBlitz
- Ecommerce Bonsai
- Statista1
- Statista2
Final thoughts
That concludes our roundup of influencer marketing statistics. We hope you found it informative.
If you’re not sure that you want to invest in influencer marketing right now, try one of these top marketing channels instead.
You might also want to check out some of our other statistics posts: