
23 Shocking Average Screen Time Statistics For 2026
Looking for the latest average screen time statistics? I’ve got you covered.
These days, it seems that everyone constantly has their nose glued to the screen—whether that’s their smartphone, computer screens, or television.
And as we continue to rely on digital devices for just about everything, the amount of time we spend looking at screens has become a topic of interest.
In this post, I’ll be sharing 25 eye-opening stats and facts that reveal interesting insights into how much time we’re spending on screens and the devices and apps dominating our attention.
Top picks
- The average person spends 6 hours 40 minutes using screens every day (Datareportal)
- 56.9% of Americans use their smartphones as their go-to screen time device (Datareportal)
- South Africans have the highest daily screen time average at 9 hours and 24 minutes (Datareportal)
- 67% of parents are concerned by their children’s screen time activities (Statista)
- The average person spends 40% of their waking hours using screens (Datareportal)
Average daily screen time statistics
First, let’s look at some general average screen time trends and statistics to better understand how often people interact with screens in their daily lives.
1. The average person spends more than 40% of their waking time using screens connected to the internet…
According to a report by Dataportal, the average person spends almost half of their waking time surfing the internet on screens. This calculation is based on the average person who sleeps for around 7-8 hours daily.
Source: Datareportal
2. …that works out as 6 hours 40 minutes of daily online screen time
The same report showed that the average time people spent accessing the internet on screens last year was 6 hours 40 minutes each day.
Interestingly, that’s increased by +4 minutes year-over-year compared to the year before. However, it’s also down by -18 minutes compared to 2021 and -14 minutes compared to 2020.
While this might seem unexpected—you’d expect the trend over time to be towards more time on screens rather than less—it’s probably something to do with the COVID pandemic.
In 2020 and 2021, national lockdowns and workplace closures meant people had more time at home to spend on their devices. Since those lockdowns have lifted, average screen time has fallen.
| Year (Q3) | Average time spent on internet-connected screens | Year-over-year change |
| 2023 | 6 hours 40 minutes | +4 minutes |
| 2022 | 6 hours 36 minutes | -22 minutes |
| 2021 | 6 hours 58 minutes | +4 minutes |
| 2020 | 6 hours 54 minutes | +16 minutes |
| 2019 | 6 hours 38 minutes | -10 minutes |
| 2018 | 6 hours 48 minutes | ~ |
Source: Datareportal2
3. On average people spend around 3 hours watching television every day
According to the report, watching television is the next most popular way people use screens after using the internet.
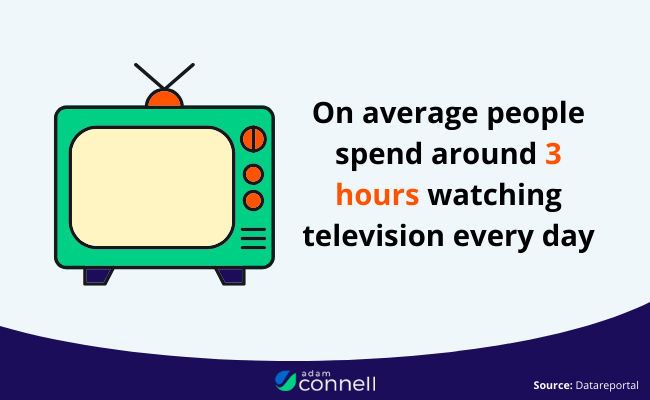
Statistics show that the average time spent watching TV is 3 hours and 6 minutes daily. This includes viewership of streaming platforms and traditional broadcast channels.
Source: Datareportal2
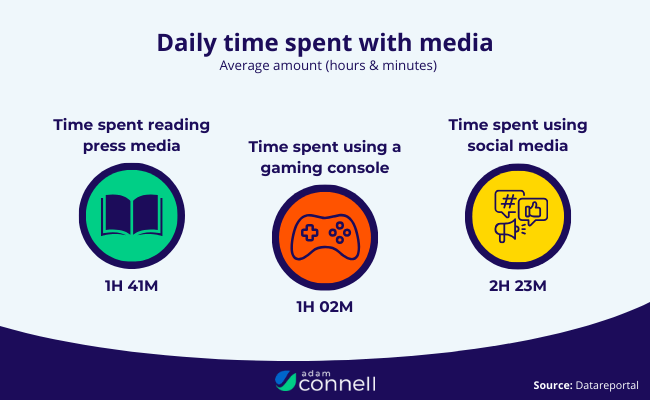
4. Gaming is the least popular daily screen time activity
While online gaming is often seen as a major screen time activity, it accounts for a smaller portion of daily screen time compared to other activities.

According to the data, gaming takes up only 1 hour and 3 minutes of average daily screen time. Time spent gaming has also decreased by -12 minutes year-over-year.
Social media scrolling, streaming videos, and work-related screen use far outweigh the time spent on gaming for most people. This shows that gaming, despite its popularity, isn’t the main driver of our overall screen habits.
Source: Datareportal2
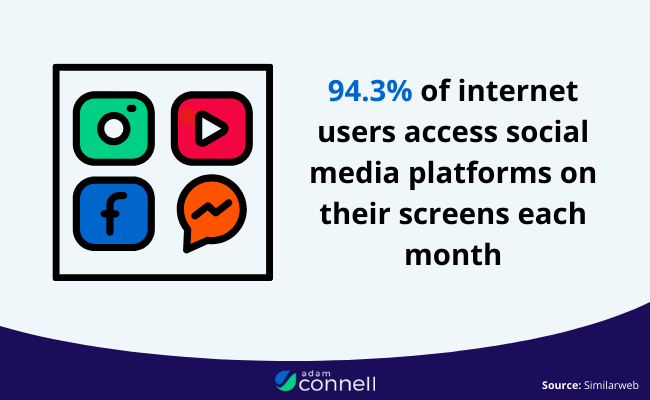
5. 94.3% of internet users access social media platforms on their screens each month
Social media contributes heavily to average screen time usage. Almost 100% of internet users aged 16 to 64 use social media on their devices monthly.
Source: Datareportal2
Average screen time statistics by country
Next, let’s explore average screen time statistics by country to see how people around the world are spending their time online.
6. South Africa has the highest daily screen time average in the world
South Africans spend more time on internet-connected screens than any other population worldwide. According to the data, they access the internet for 9 hours and 21 minutes per day. That’s almost 3 hours more than the global average.

| Top 5 countries with the highest daily internet use | Time spent online |
| 1. South Africa | 9 hours 21 minutes |
| 2. Brazil | 9 hours 15 minutes |
| 3. Philippines | 8 hours 52 minutes |
| 4. Colombia | 8 hours 43 minutes |
| 5. Chile | 8 hours 41 minutes |
Source: Datareportal2
7. Japan has the lowest daily screen time average in the world
According to statistics, Japanese people use internet-connected screens for just less than 4 hours per day. That’s more than 5 hours less than the average person in South Africa and more than 2 hours less than the global average
| Top 5 countries with the lowest daily internet use | Time spent online |
| Japan | 3 hours 56 minutes |
| Denmark | 5 hours 8 minutes |
| South Korea | 5 hours 19 minutes |
| Germany | 5 hours 22 minutes |
| France | 5 hours 22 minutes |
Source: Datareportal2
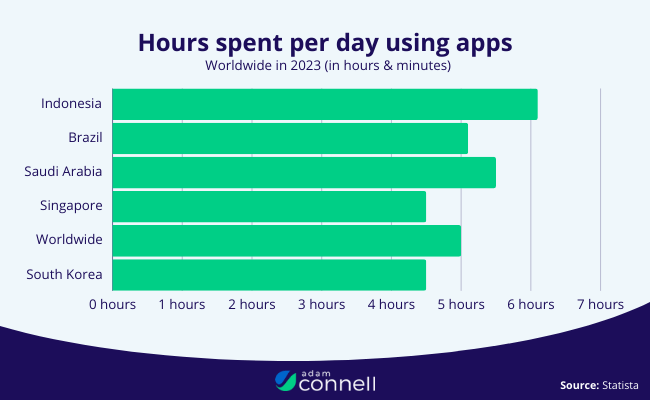
8. Indonesian people spend more than 6 hours using smartphone apps every day
Indonesians spend more time using apps on their smartphones than any other population globally. According to statistics, they spend 6 hours and 5 minutes using apps every day, and this figure has been increasing year over year.
Source: Statista4
Age-related average screen time statistics
In this section, we’ll take a look at age-related screen time statistics to uncover how different generations interact with screens. From children to seniors, these insights reveal how screen habits vary across age groups.
9. Gen Z spends around 3 hours on social media per day
According to a global survey conducted by Statista, Gen Z spends an average of 3 hours per day looking at social media on their screens alone. They have the highest average screen time of any generation.

In comparison, Gen X spends an average of just 1 hour and 30 minutes on social media per day—that’s around half the time spent by Gen Zers.
Source: Statista2
10. Tweens spend over 5 hours a day using screens for entertainment
A study by Common Sense Media found that tweens (children aged 8-12) use screens for entertainment for a total of around 5 hours and 33 minutes per day.

That’s significantly less than teens, who use screens for entertainment for 8 hours and 39 minutes a day. However, it’s increased by around an hour since the pandemic.
Source: Common Sense Media
11. Baby Boomers spend the least time using screens overall
According to a recent daily screen time survey, those classed as the Baby Boomer generation spend around 3.5 hours on screens every day. This is only a little over half as much as younger generations, who access screens for over 6 hours per day on average.
Source: Statista5
12. 49% of 0 to 2-year-olds already interact with smartphones…
It looks like humans start using screens from a worryingly young age. Shockingly, almost half of babies and toddlers under the age of two are already interacting with their parents’ smartphones, according to data from Pew Research.
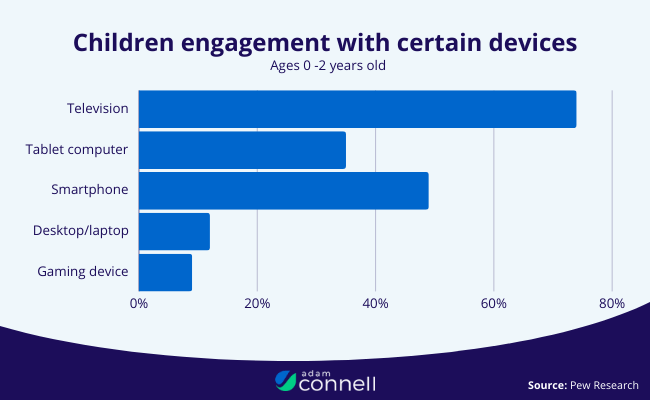
What’s more, almost three-quarters (74%) said that their children already watch TV at this age.
Source: Pew Research
13. …and 62% of 3-4 year olds use them too
Older children are even more likely to be using screens. The same study from Pew Research found that 62% of parents said their 3 to 4-year-old children were already interacting with smartphones.
What’s more, 64% of 3 to 4-year-olds also use tablet computers.
Source: Pew Research
Average screen time by devices & activities
Most people interact with multiple different screens on any given day. Here are some statistics highlighting the different devices people use to connect to the internet around the world.
14. In the UK, the most common screens used for online activities are smartphones
Overall, UK users have an average daily online screen time of around 4.23 hours, 3.28 hours of which are spent on their smartphones. Computer screen time takes up a much smaller portion of total daily screen time compared to mobile.

Source: Statista
15. In the US, 56.9% of people use their smartphones for their online activities
In the US, smartphones also seem to be the go-to device when it comes to screen time. According to Statista, 56.9% of internet usage takes place on smartphones in the US.
Source: Statista6
16. Ghanaians use their smartphones for screen time more often than anyone else
According to data by Statista, mobile screen time is highest in Ghana. Ghanaians spend more time using their smartphones to access the internet than any other country—around 6 hours and 15 minutes per day.
Source: Statista1
17. Around 76% of users spend their screen time watching on-demand TV services…
According to a 2024 study, just over three-quarters of internet users spend time watching on-demand TV and streaming services on their screens. Some of the most popular apps include Netflix, Disney+ and Hulu.
Source: Datareportal2
18. …and less than 50% of young people watch traditional broadcast TV
According to a BBC Ofcom study, only 48% of 16-24-year-olds tune in to broadcast TV each week. This has dropped substantially from 76% in 2018. Meanwhile, time spent watching TV on-demand online has increased.
Source: BBC
The impact of screen time
The impact of rising screen time extends far beyond sore eyes. From mental health challenges like increased anxiety and sleep disruption to concerns for children’s online safety, the effects of too much screen time can be profound.
Let’s look at some stats that tell us more about the impact of screen time.
19. 67% of UK parents say their main concern regarding screen time is what their children watch
A study by Statista shows that parents in the UK are generally interested and positive when it comes to children using screens. However, one of their main concerns is online safety.

67% of UK parents said that they were concerned about what their children were watching on the internet, despite seeing real value in their child’s screen time.
Source: Statista3
20. Spending over 2 hours using screens daily can have a detrimental effect on memory and processing
According to a study published by the UK Parliament, children who spend over 2 hours per day looking at screens have worse working memory than those with lower screen time averages.
Not only this, but 2+ hours per day of screen time also negatively impacted the subjects’ processing power, attention levels, and even language skills.
Source: UK Parliament
21. Spending 3+ hours on screens daily can increase susceptibility to type 2 diabetes in children
In the UK, children aged 9 to 10 who spend more than three hours daily on screens are more likely to exhibit insulin resistance, a key risk factor for developing Type 2 diabetes. The study also noted that an increase in obesity was related to higher average screen time.
Source: Journalists Resource
22. Spending over 7 hours using screens daily has been linked to issues with psychological well-being
According to a study published by the National Library of Medicine, young people with screen time averages of 7 hours per day or more were more than twice as likely to be diagnosed with depression and anxiety when compared to their counterparts who had less than 1 hour of screen time per day.

Source: National Library of Medicine
23. 70% of adults report that their eyes feel strained after looking at screens
According to an article published by People, long periods of average screen time have a negative effect on users’ eyesight.
When surveyed, 7 in 10 people said that their eyes felt strained from using screens, and only 4 in 10 remembered to rest their eyes hourly when using screens.
Source: People
Final thoughts
As these stats show, average screen times are remarkably high all around the world.
Whether or not these figures will continue to grow from here, and what the long-term effects of excessive screen time will be, remain to be seen.
Interested to know more about how people are spending time online and on social media? Check out our roundup of the latest social media statistics and our ranking of the leading social media platforms by users. You may also be interested in these influencer marketing statistics.